Trading Futures at Webull
Webull does not offer futures trading at this time. As an alternative, we recommend
Ninjatrader that specializes in trading
futures. Contracts are $0.35 / Micro, $1.29 / Standard per side without monthly fees. With a $99 monthly fee,
the rates drop to $0.25 / Micro and $0.99 / Standard per side.
Free Ninjatrader Account
Open Ninjatrader Account
Free Webull Account
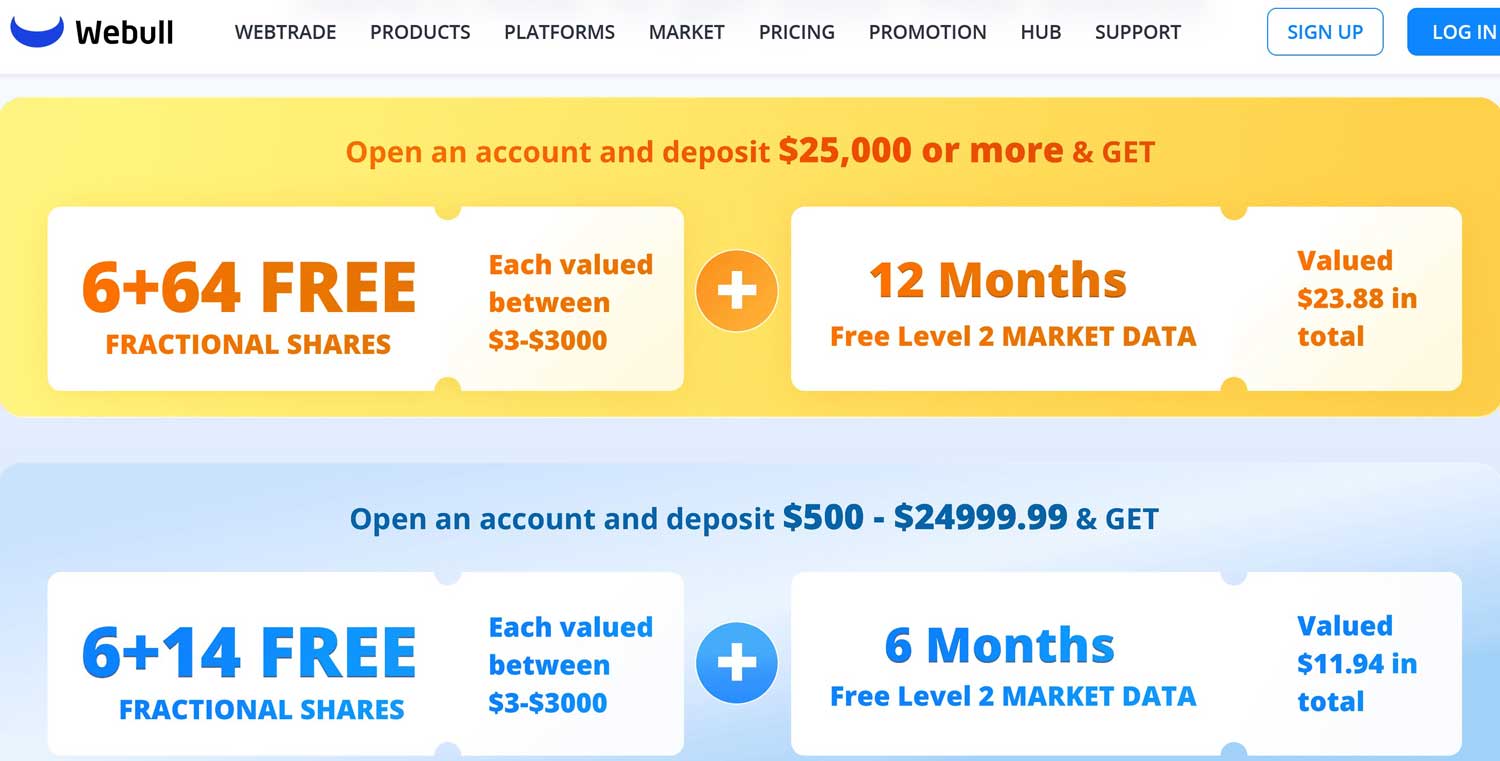
Get up to 75 free stocks when you deposit money at Webull!
Open Webull Account
Webull Charges
Despite advertising $0 commissions, Webull does charge fees for some trading activities. Here are all the details you need to know:
Margin Fees
Webull offers margin accounts with 4x day-trading leverage and 2x overnight leverage. The margin
interest rate the broker charges varies by balance. Currently, a debit under $25,000 costs
9.74% annually. The rate is calculated on a daily basis
and charged to the account once per month.
Webull’s margin rate begins dropping by 50 basis points after the loan goes above $25,000.
Webull Account Fees
Webull charges nothing to open, maintain, or close an account. This generous policy applies to both retirement and taxable accounts.
Shorting Fees
If you short a stock at Webull, the brokerage firm charges interest. After all, you are borrowing something, and fees are usually assessed when you do that. The broker’s short fee varies from day to day and from stock to stock.
Withdrawal and Deposit Fees
If an ACH is reversed or returned for any reason, Webull charges $30. There are no deposit and withdrawal fees normally when using the ACH system.
For wires, it’s a different story. An incoming domestic wire is $8. This is an unusual policy. Most financial institutions don’t charge anything for incoming domestic wires. E*Trade is one example. A withdrawal via wire at Webull is $25. If any wire fails for any reason, there is a $30 fee.
International wires are even more expensive. A deposit costs $12.50 per instance; while going in the other direction is a very steep $45.
Account Transfers
There is no charge to transfer cash or securities into a Webull account. However, a transfer out costs $75.

Hard Copies
Electronic documents at Webull are free. The broker does charge $2.50 for a paper prospectus. There is an additional charge for confirmations and statements sent through snail mail. The fee is 25¢ per page.
Regulatory Fees
Although there are no commissions assessed on trades, Webull does pass on exchange and regulatory fees to its customer. These include a sell-side SEC fee of 0.00207% of the total trade amount, with a 1¢ minimum. FINRA also imposes a sell-side charge. It is 0.0119% with a 1¢ minimum and a $5.95 maximum.
Comparison
Many other brokerage firms today charge $0 on stock and ETF transactions. These companies include
Firstrade and
Robinhood.
Some brokerage houses charge nothing for paper statements. Fidelity is an example.
A few brokerage firms still have IRA closeout fees. Merrill Edge is one such broker.
Webull Promotion
Open Webull Account
|